
A multi-criteria assessment of landslide susceptibility, infrastructure gaps, and population density in Khyber Pakhtunkhwa (KPK), Pakistan.
Data & Skills
Data & Tools: NASA’s LHASA 2.0 Landslide Data, WorldPop, HOTOSM Roads, QGIS, Python (Network Analysis)
Skills & Knowledge Gained:
- Multi-criteria decision-making (AHP)
- Network analysis for healthcare accessibility
- Cost-surface modeling for hazard scenarios
- Integration of hazard, population, and infrastructure data
Study Overview
This study evaluates community vulnerability to landslides in Khyber Pakhtunkhwa (KPK), Pakistan, focusing on the interplay between landslide susceptibility and infrastructure deficiencies. By combining NASA’s LHASA 2.0 data, WorldPop population density, and hospital attributes, we applied the Analytic Hierarchy Process (AHP) to weight exposure, sensitivity, and adaptive capacity indicators, with infrastructure emerging as the most critical factor at 53.9%.
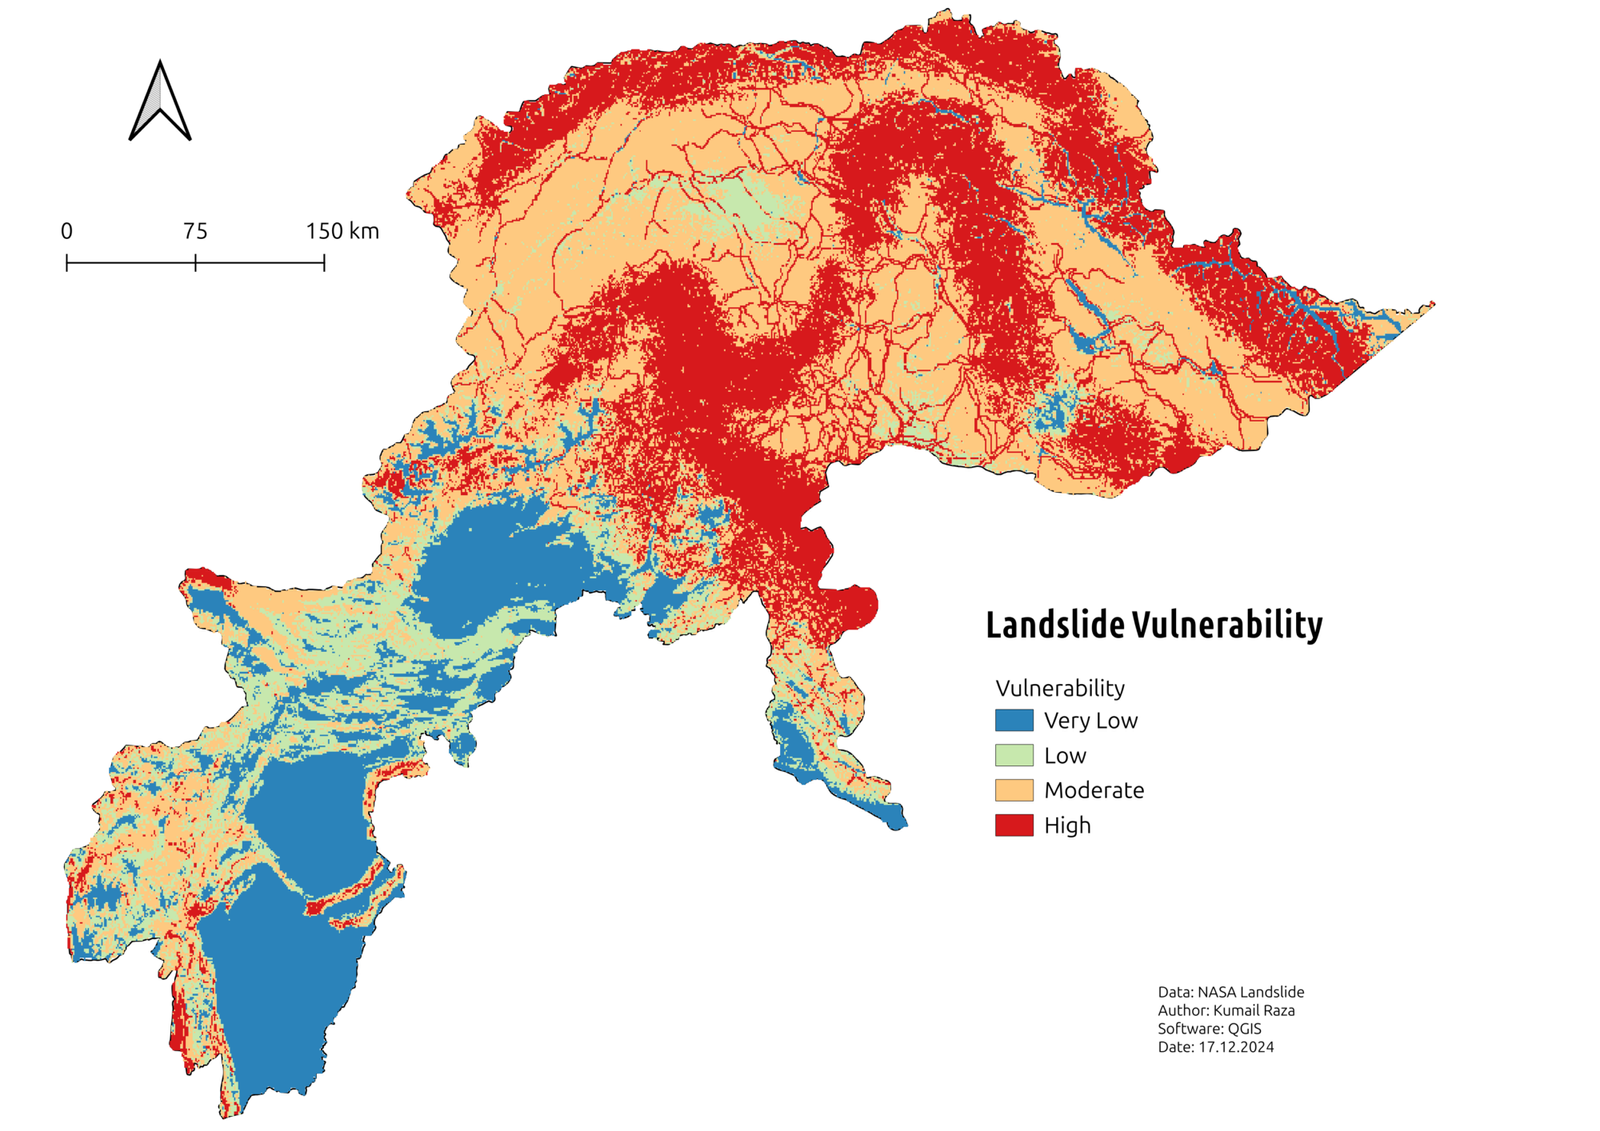
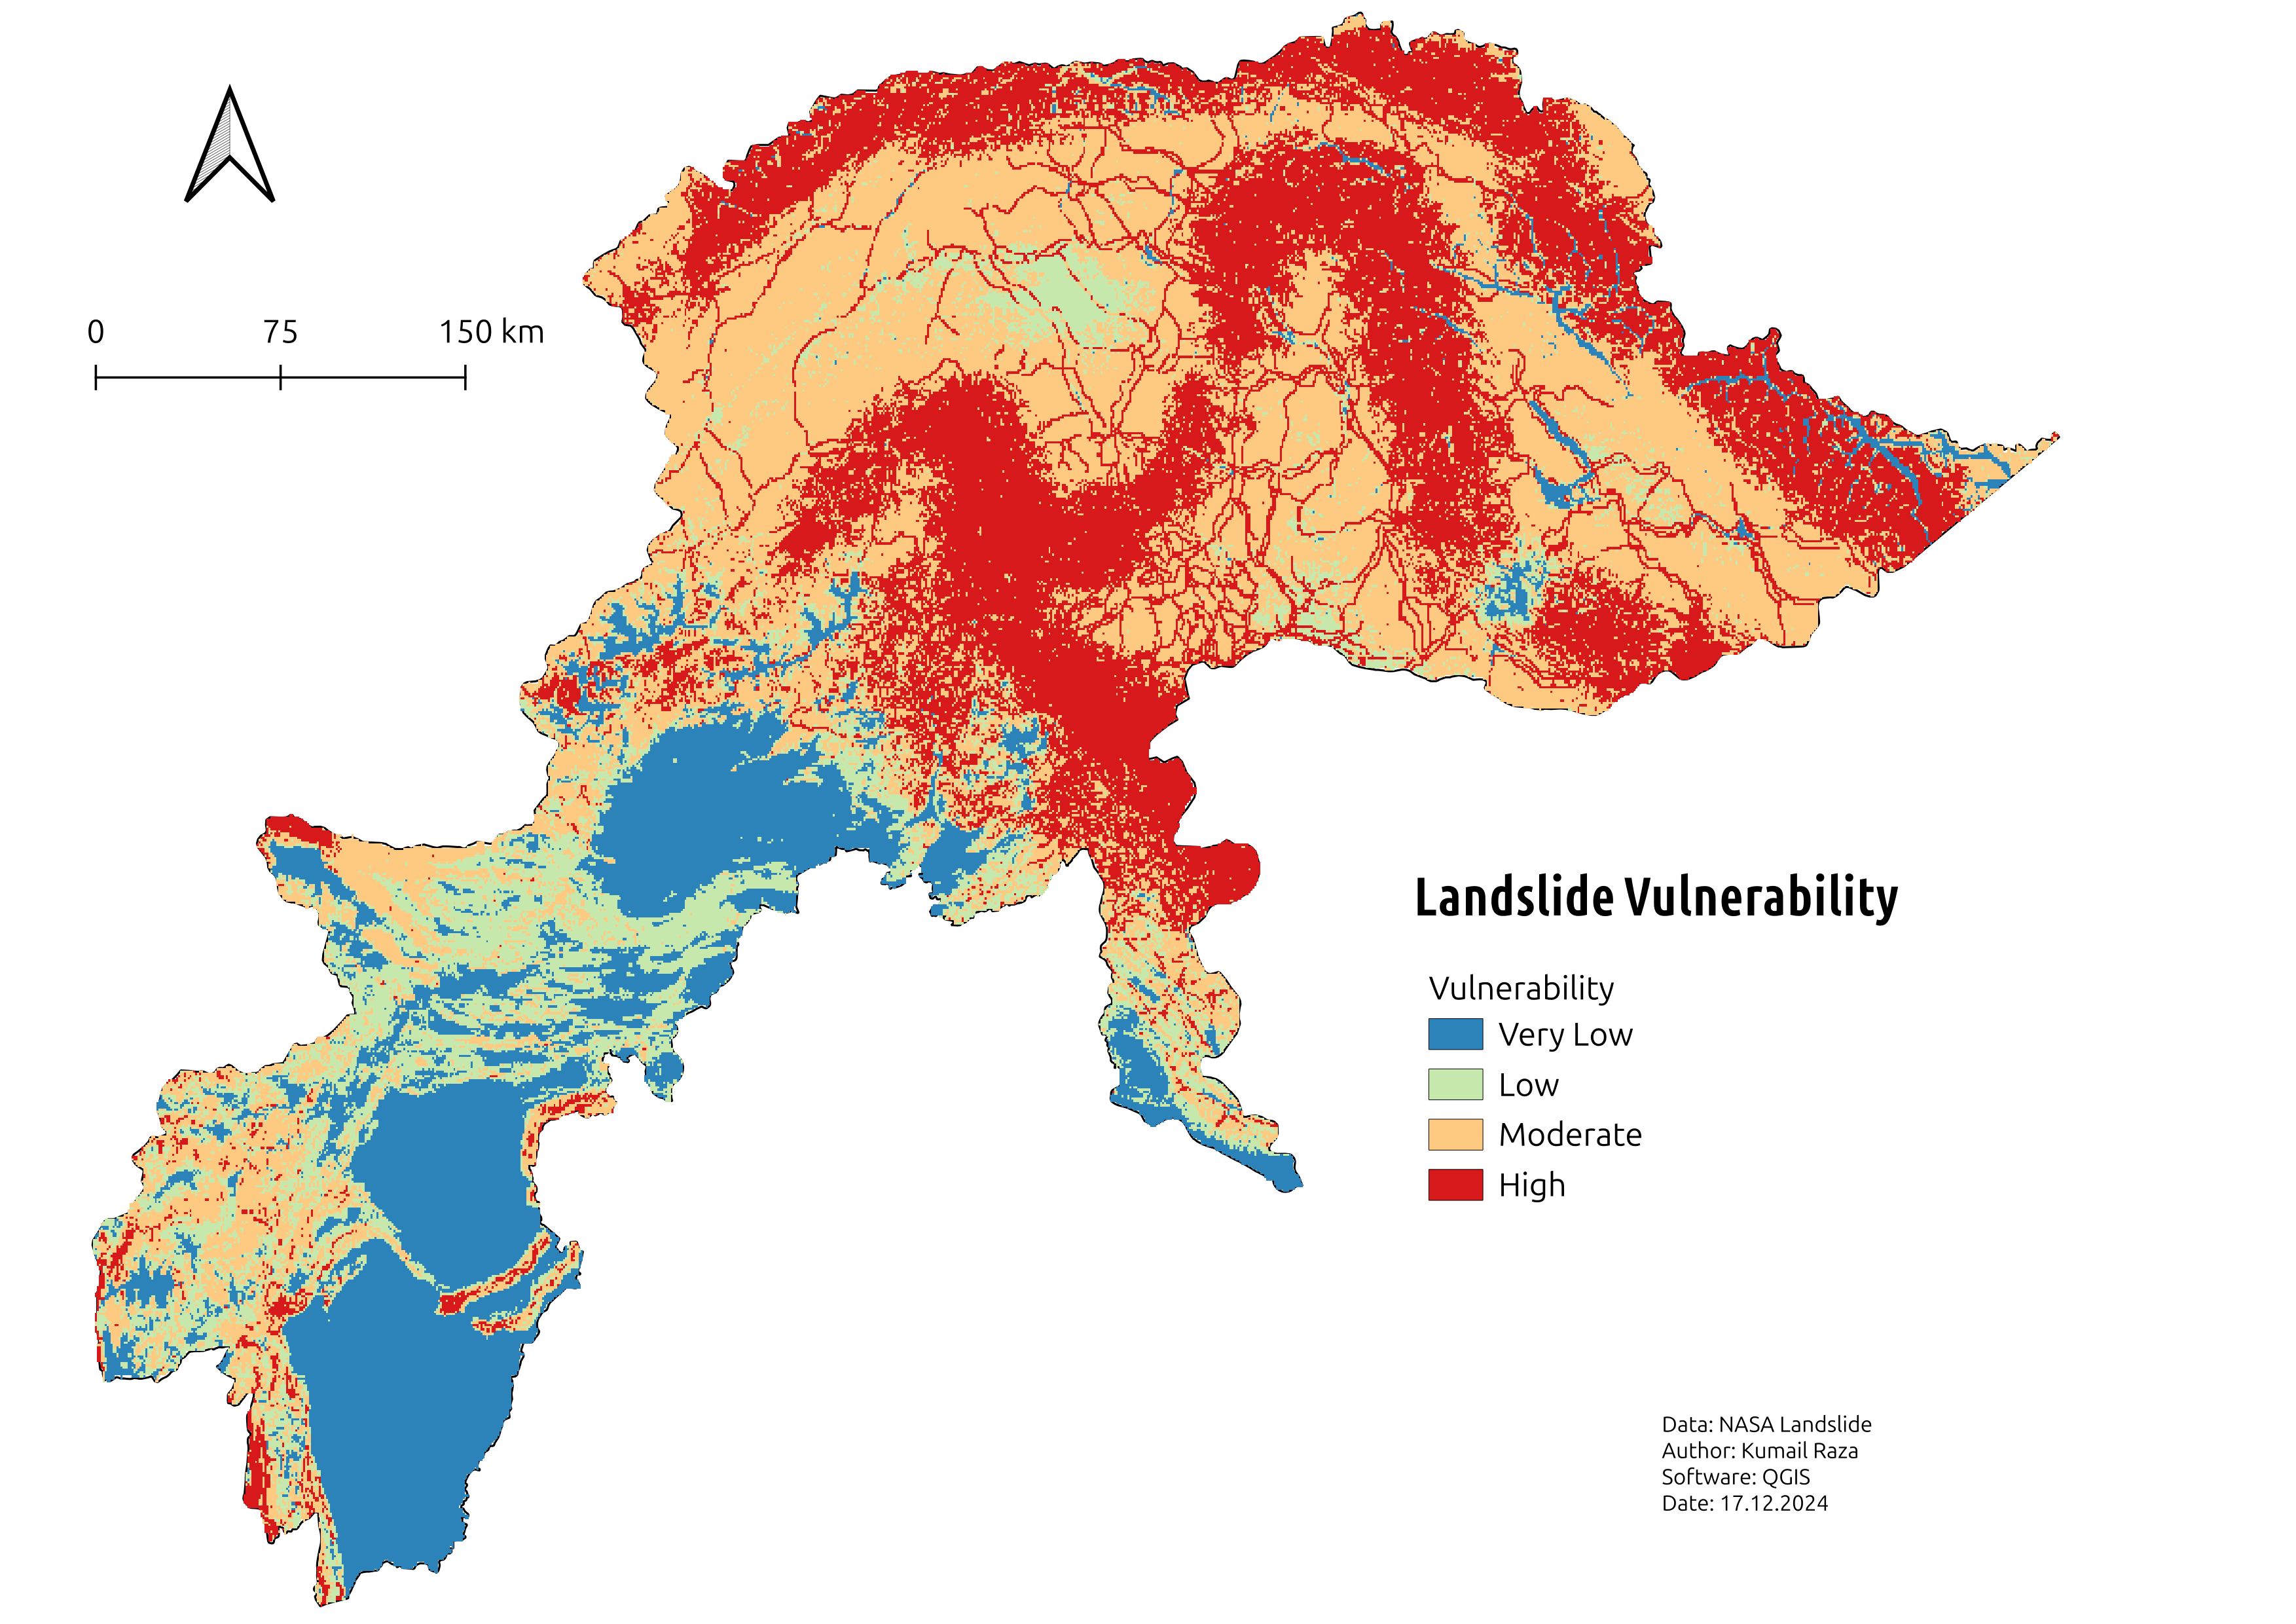
Exposure: Landslide Susceptibility
Landslide susceptibility was categorized as Very Low, Low, Moderate, or High. High-risk areas cluster in the mountainous northern regions, where steep terrain and unstable geology magnify landslide hazards.
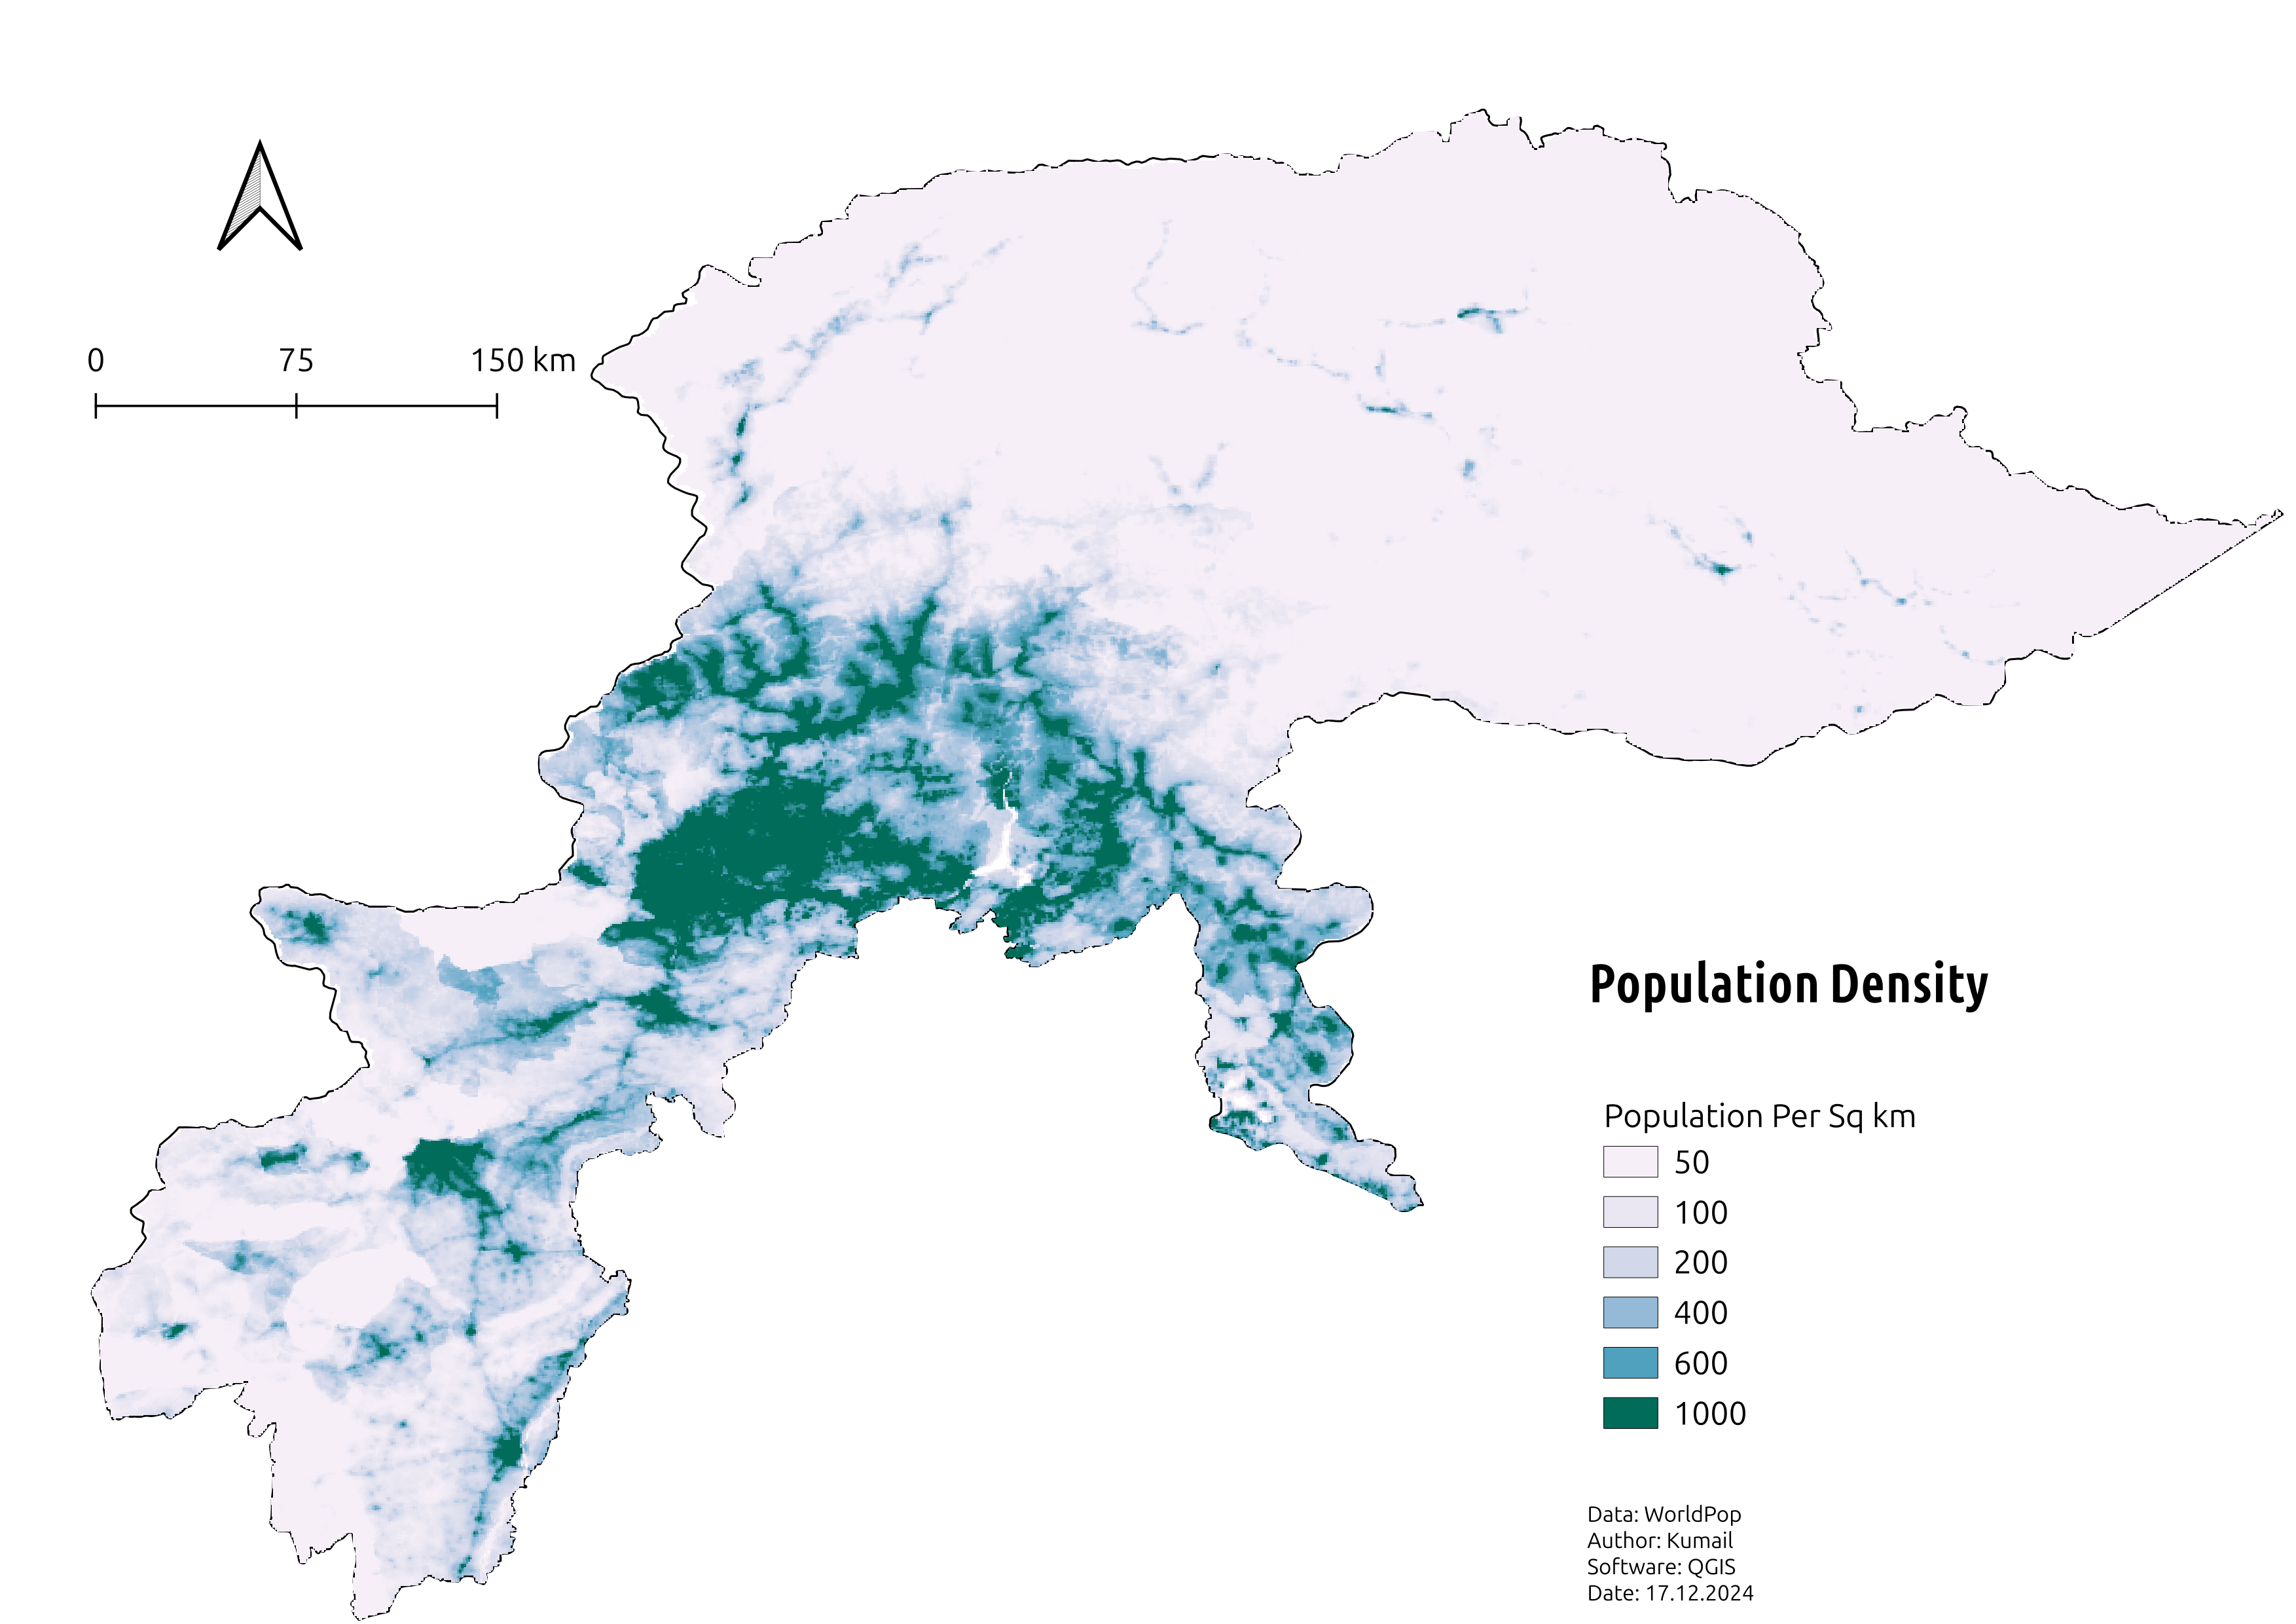
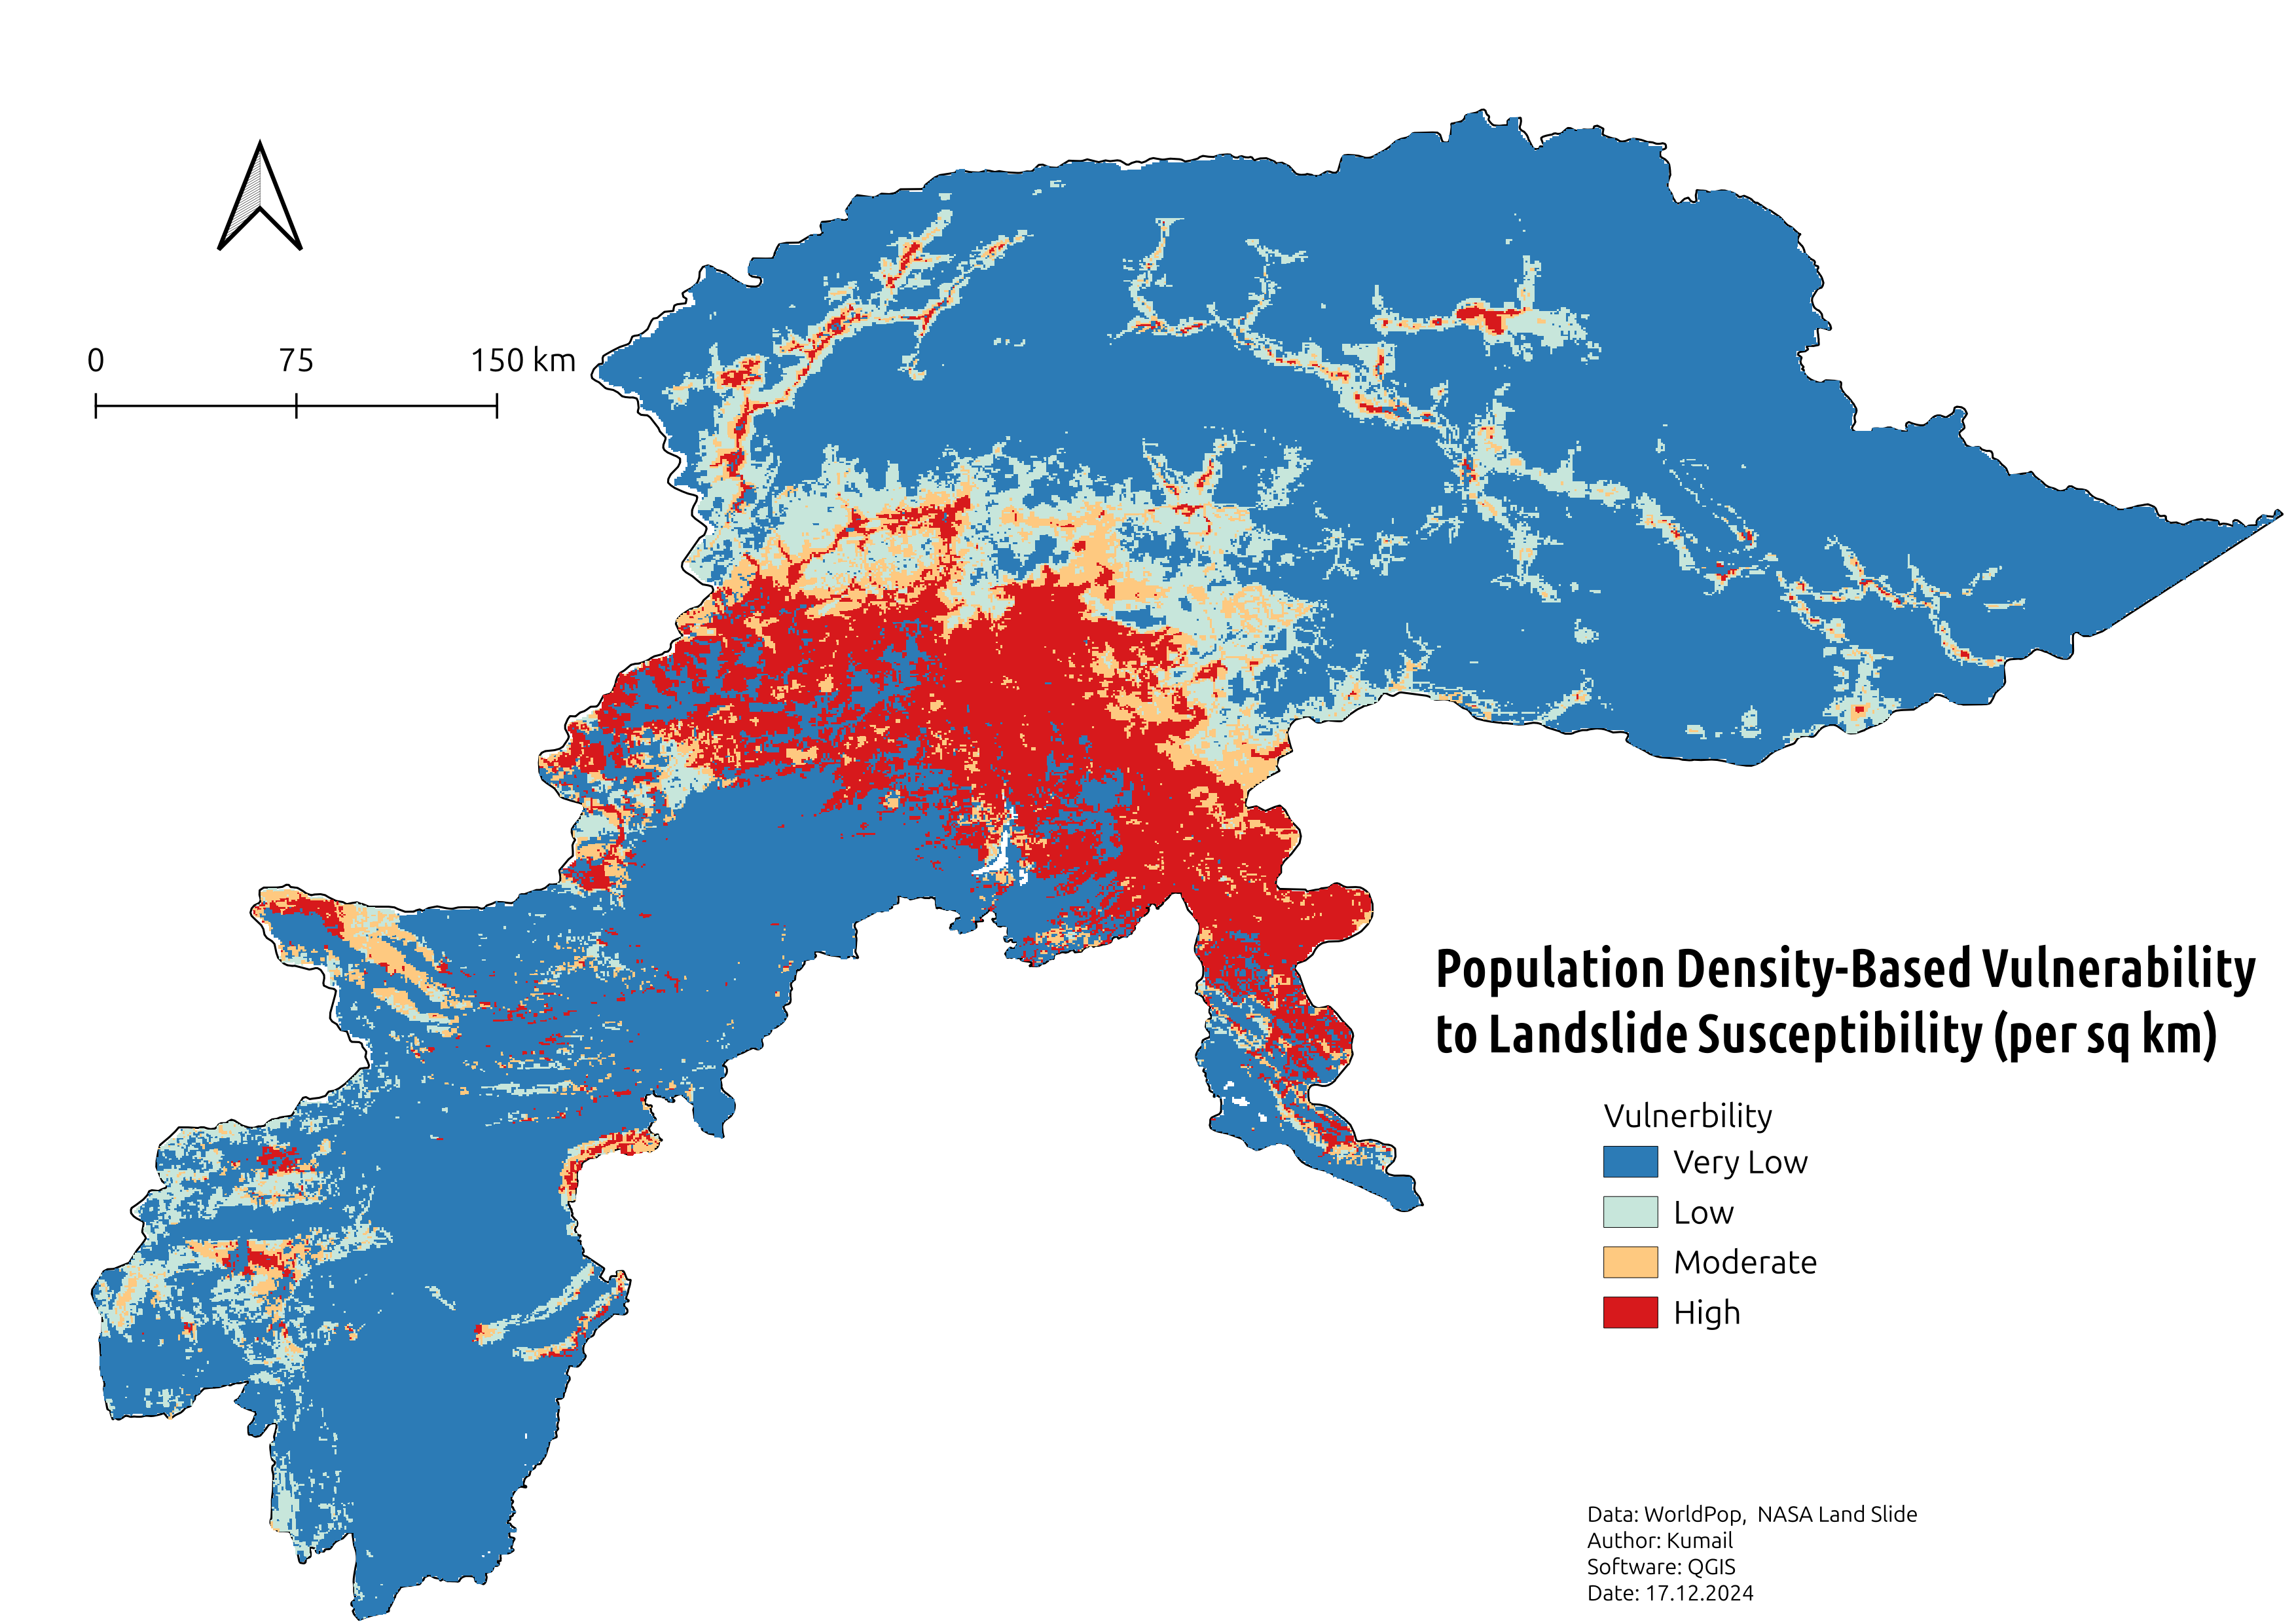
Sensitivity: Population Density
Population density peaks in urban centers, with up to 1,000 people per square kilometer. Here, disaster risk intensifies due to dense settlements, greater infrastructure demands, and heightened exposure to hazards.
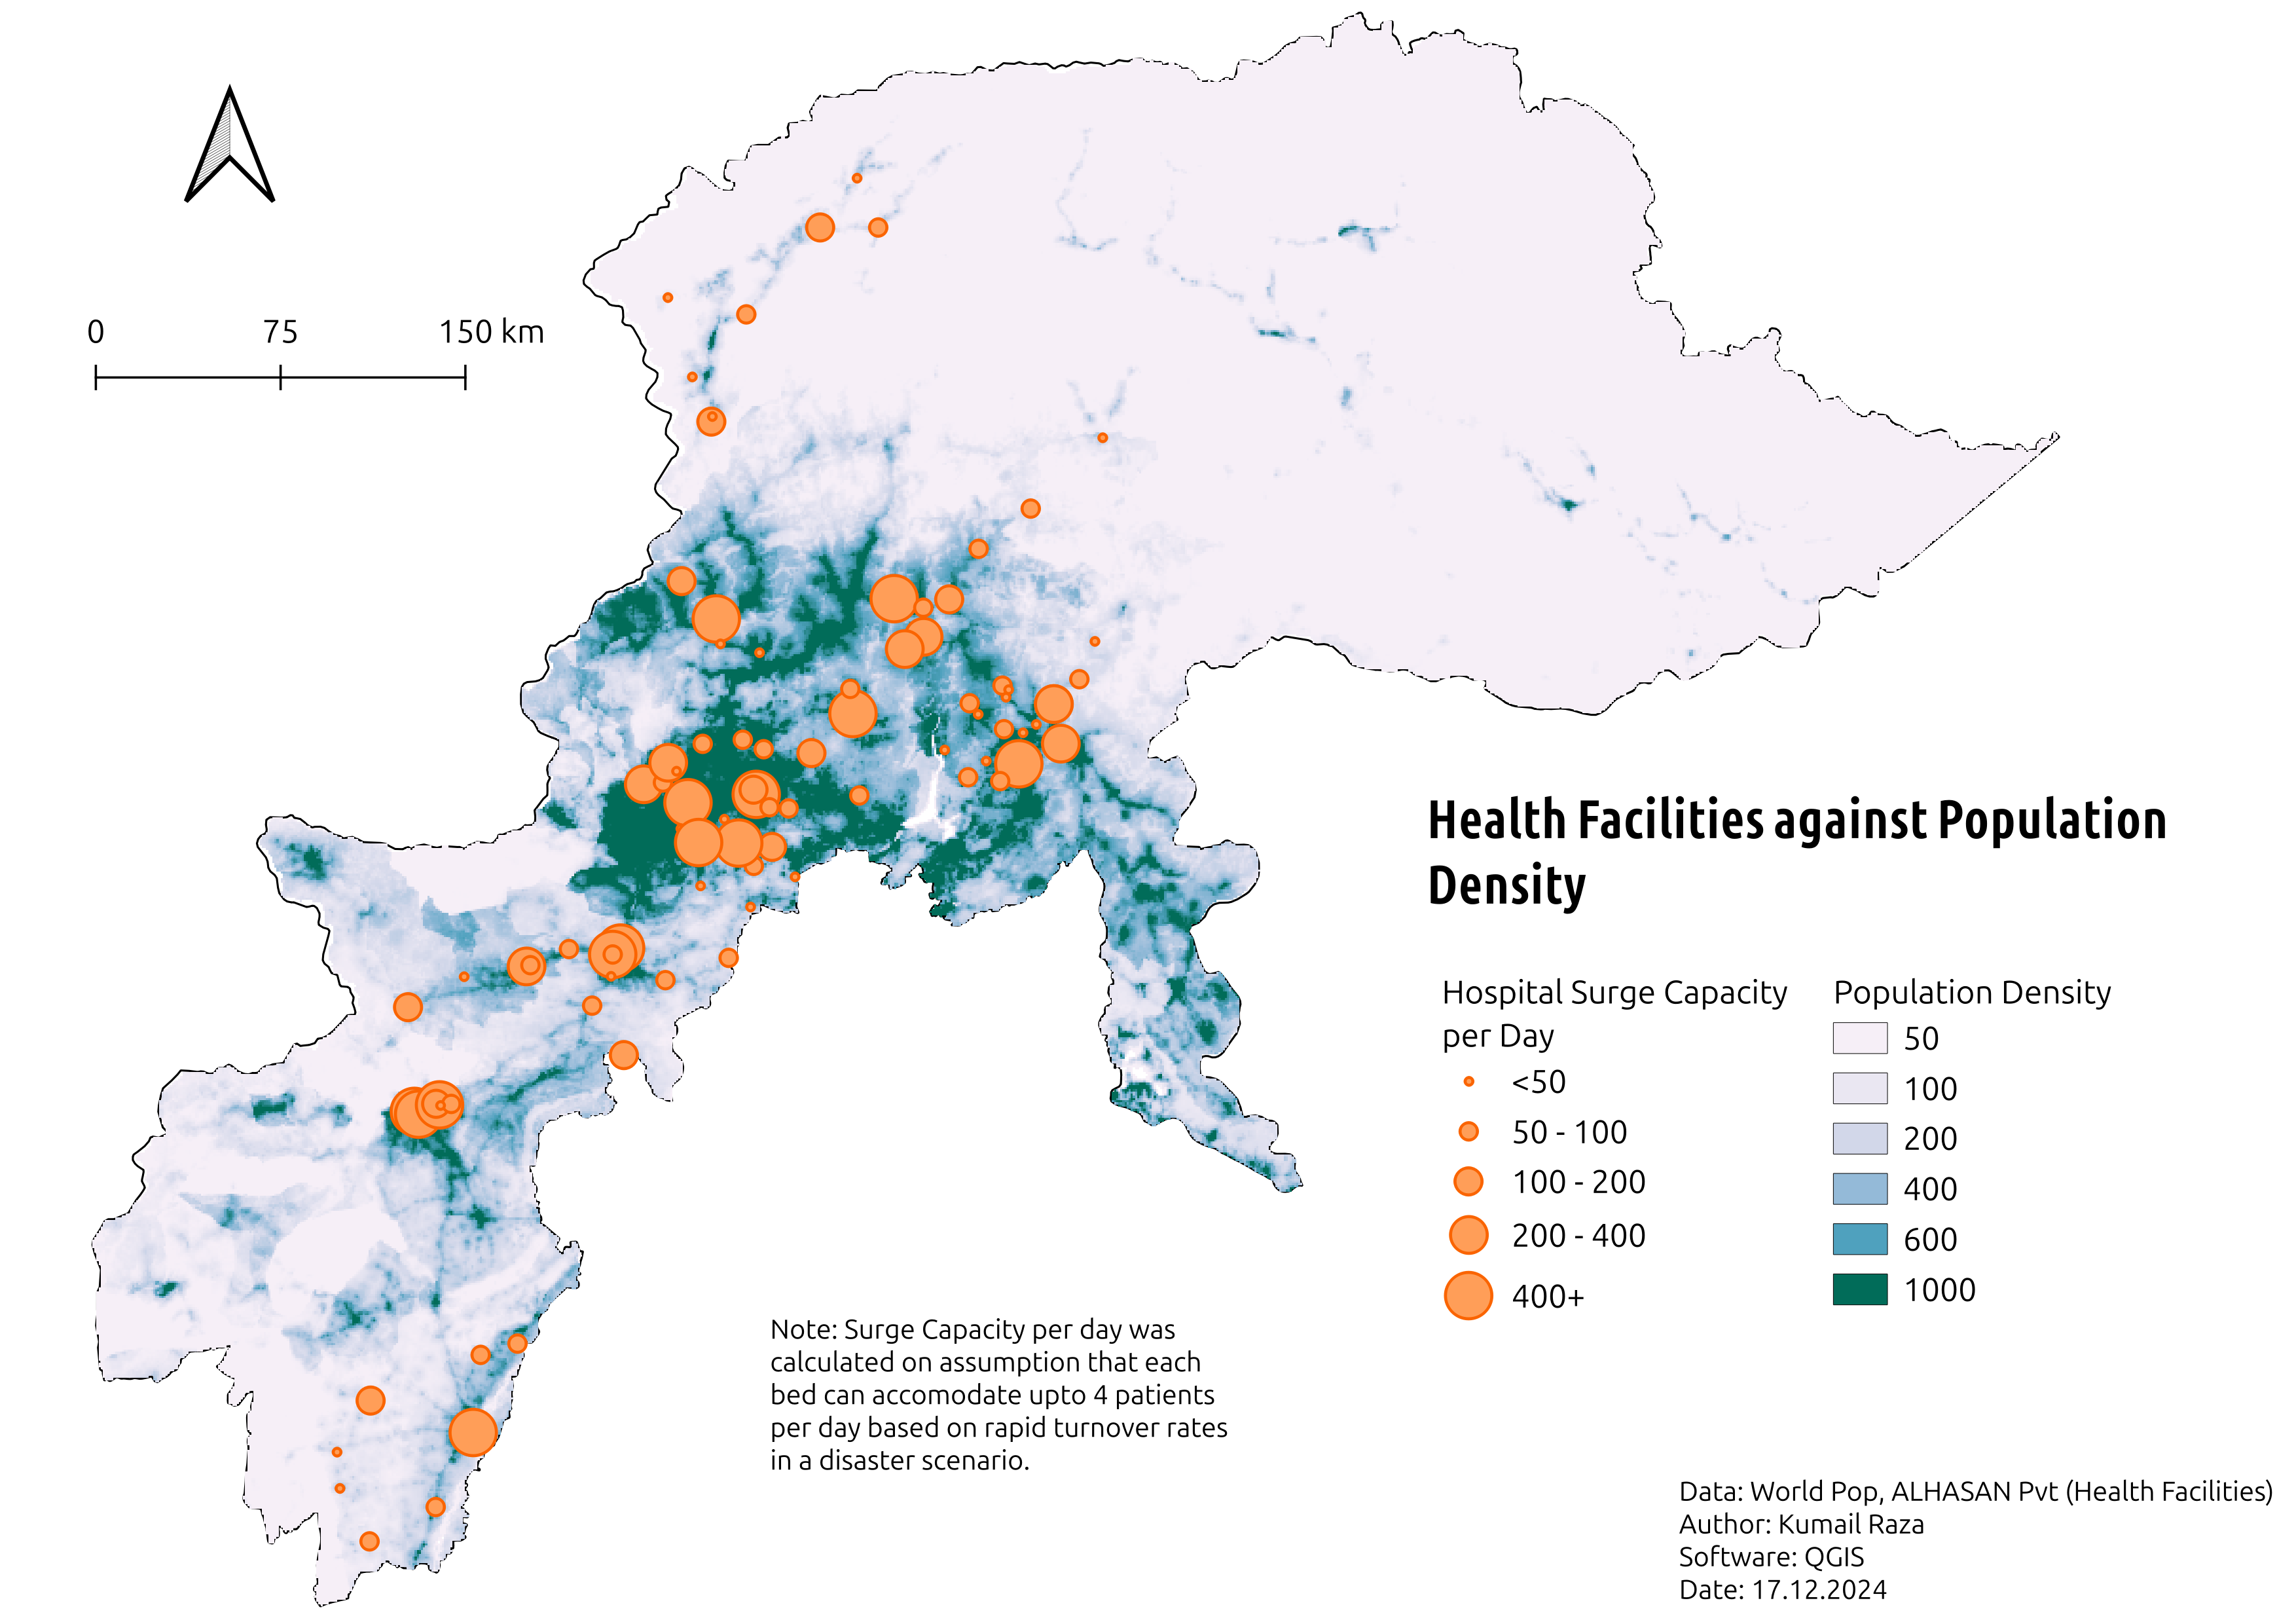
Sensitivity: Healthcare Surge Capacity
Hospital surge capacity, measured by available beds and staff readiness, is concentrated in urban locations. This amplifies rural vulnerabilities, where limited healthcare infrastructure strains emergency responses.
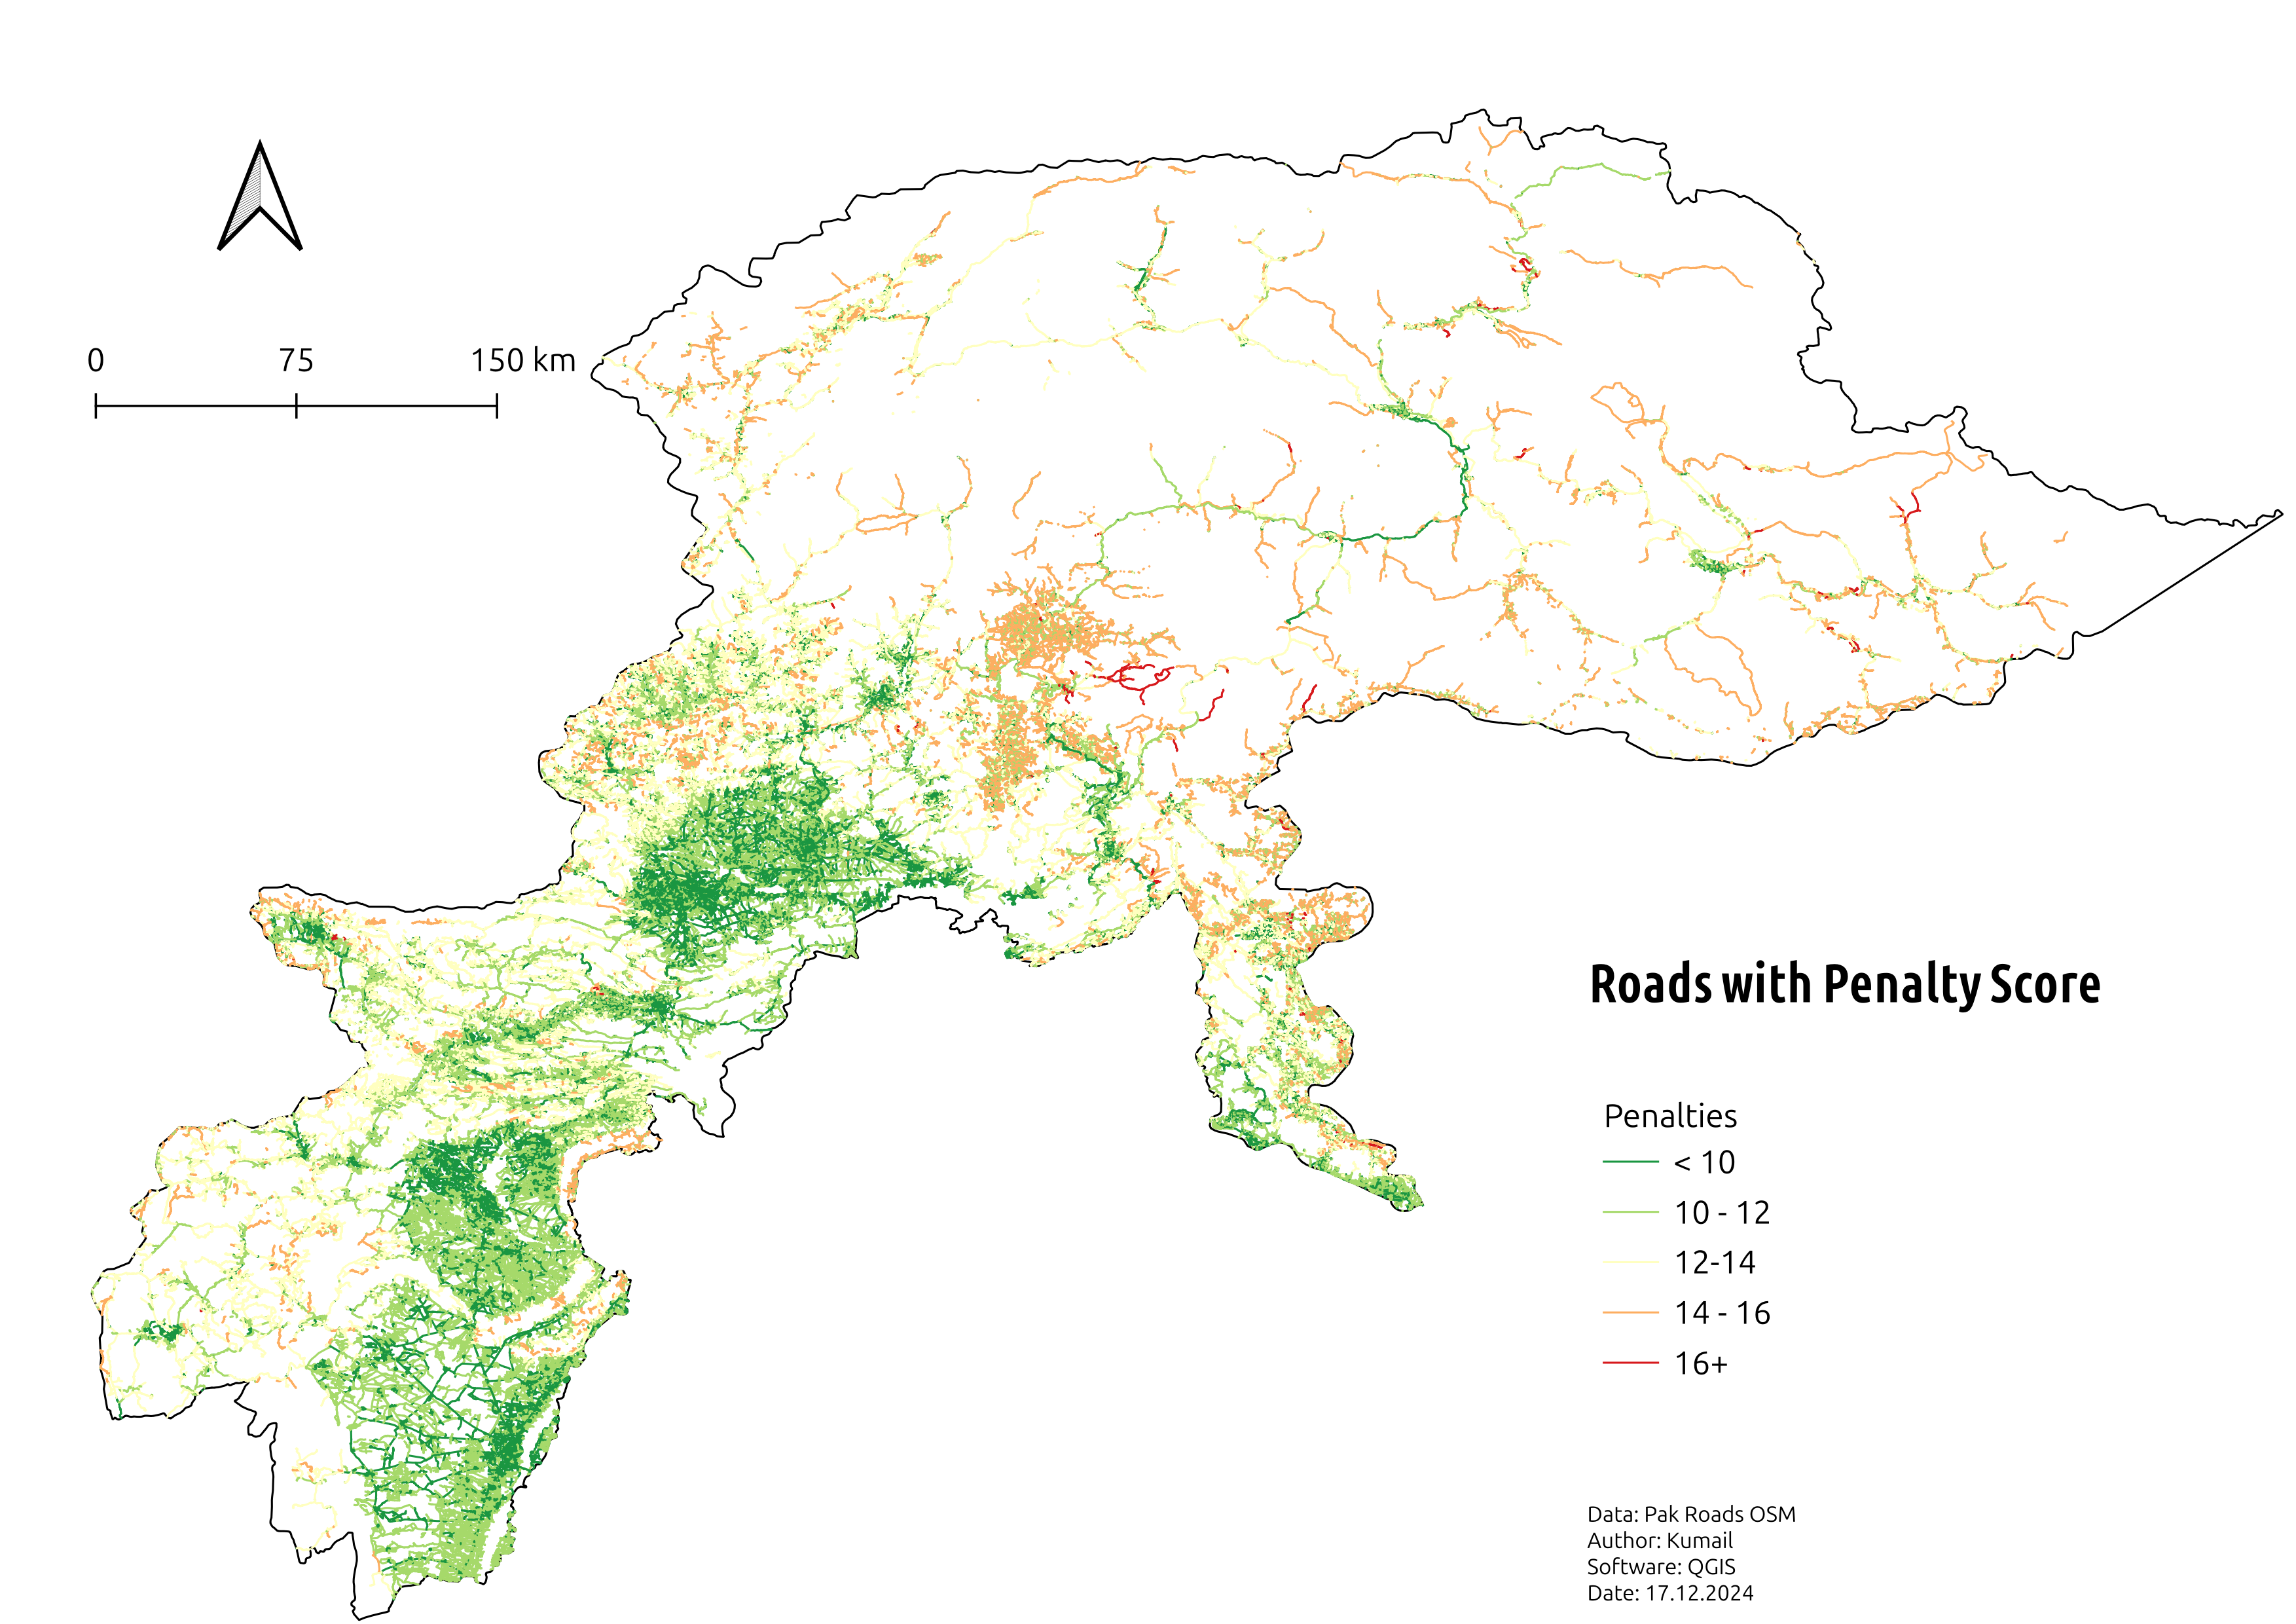
Adaptability: Infrastructure Vulnerability (Road Network)
The road network analysis penalized routes based on surface type, width, and landslide proximity. Regions with limited or substandard roads struggle to adapt and respond effectively to disaster scenarios.
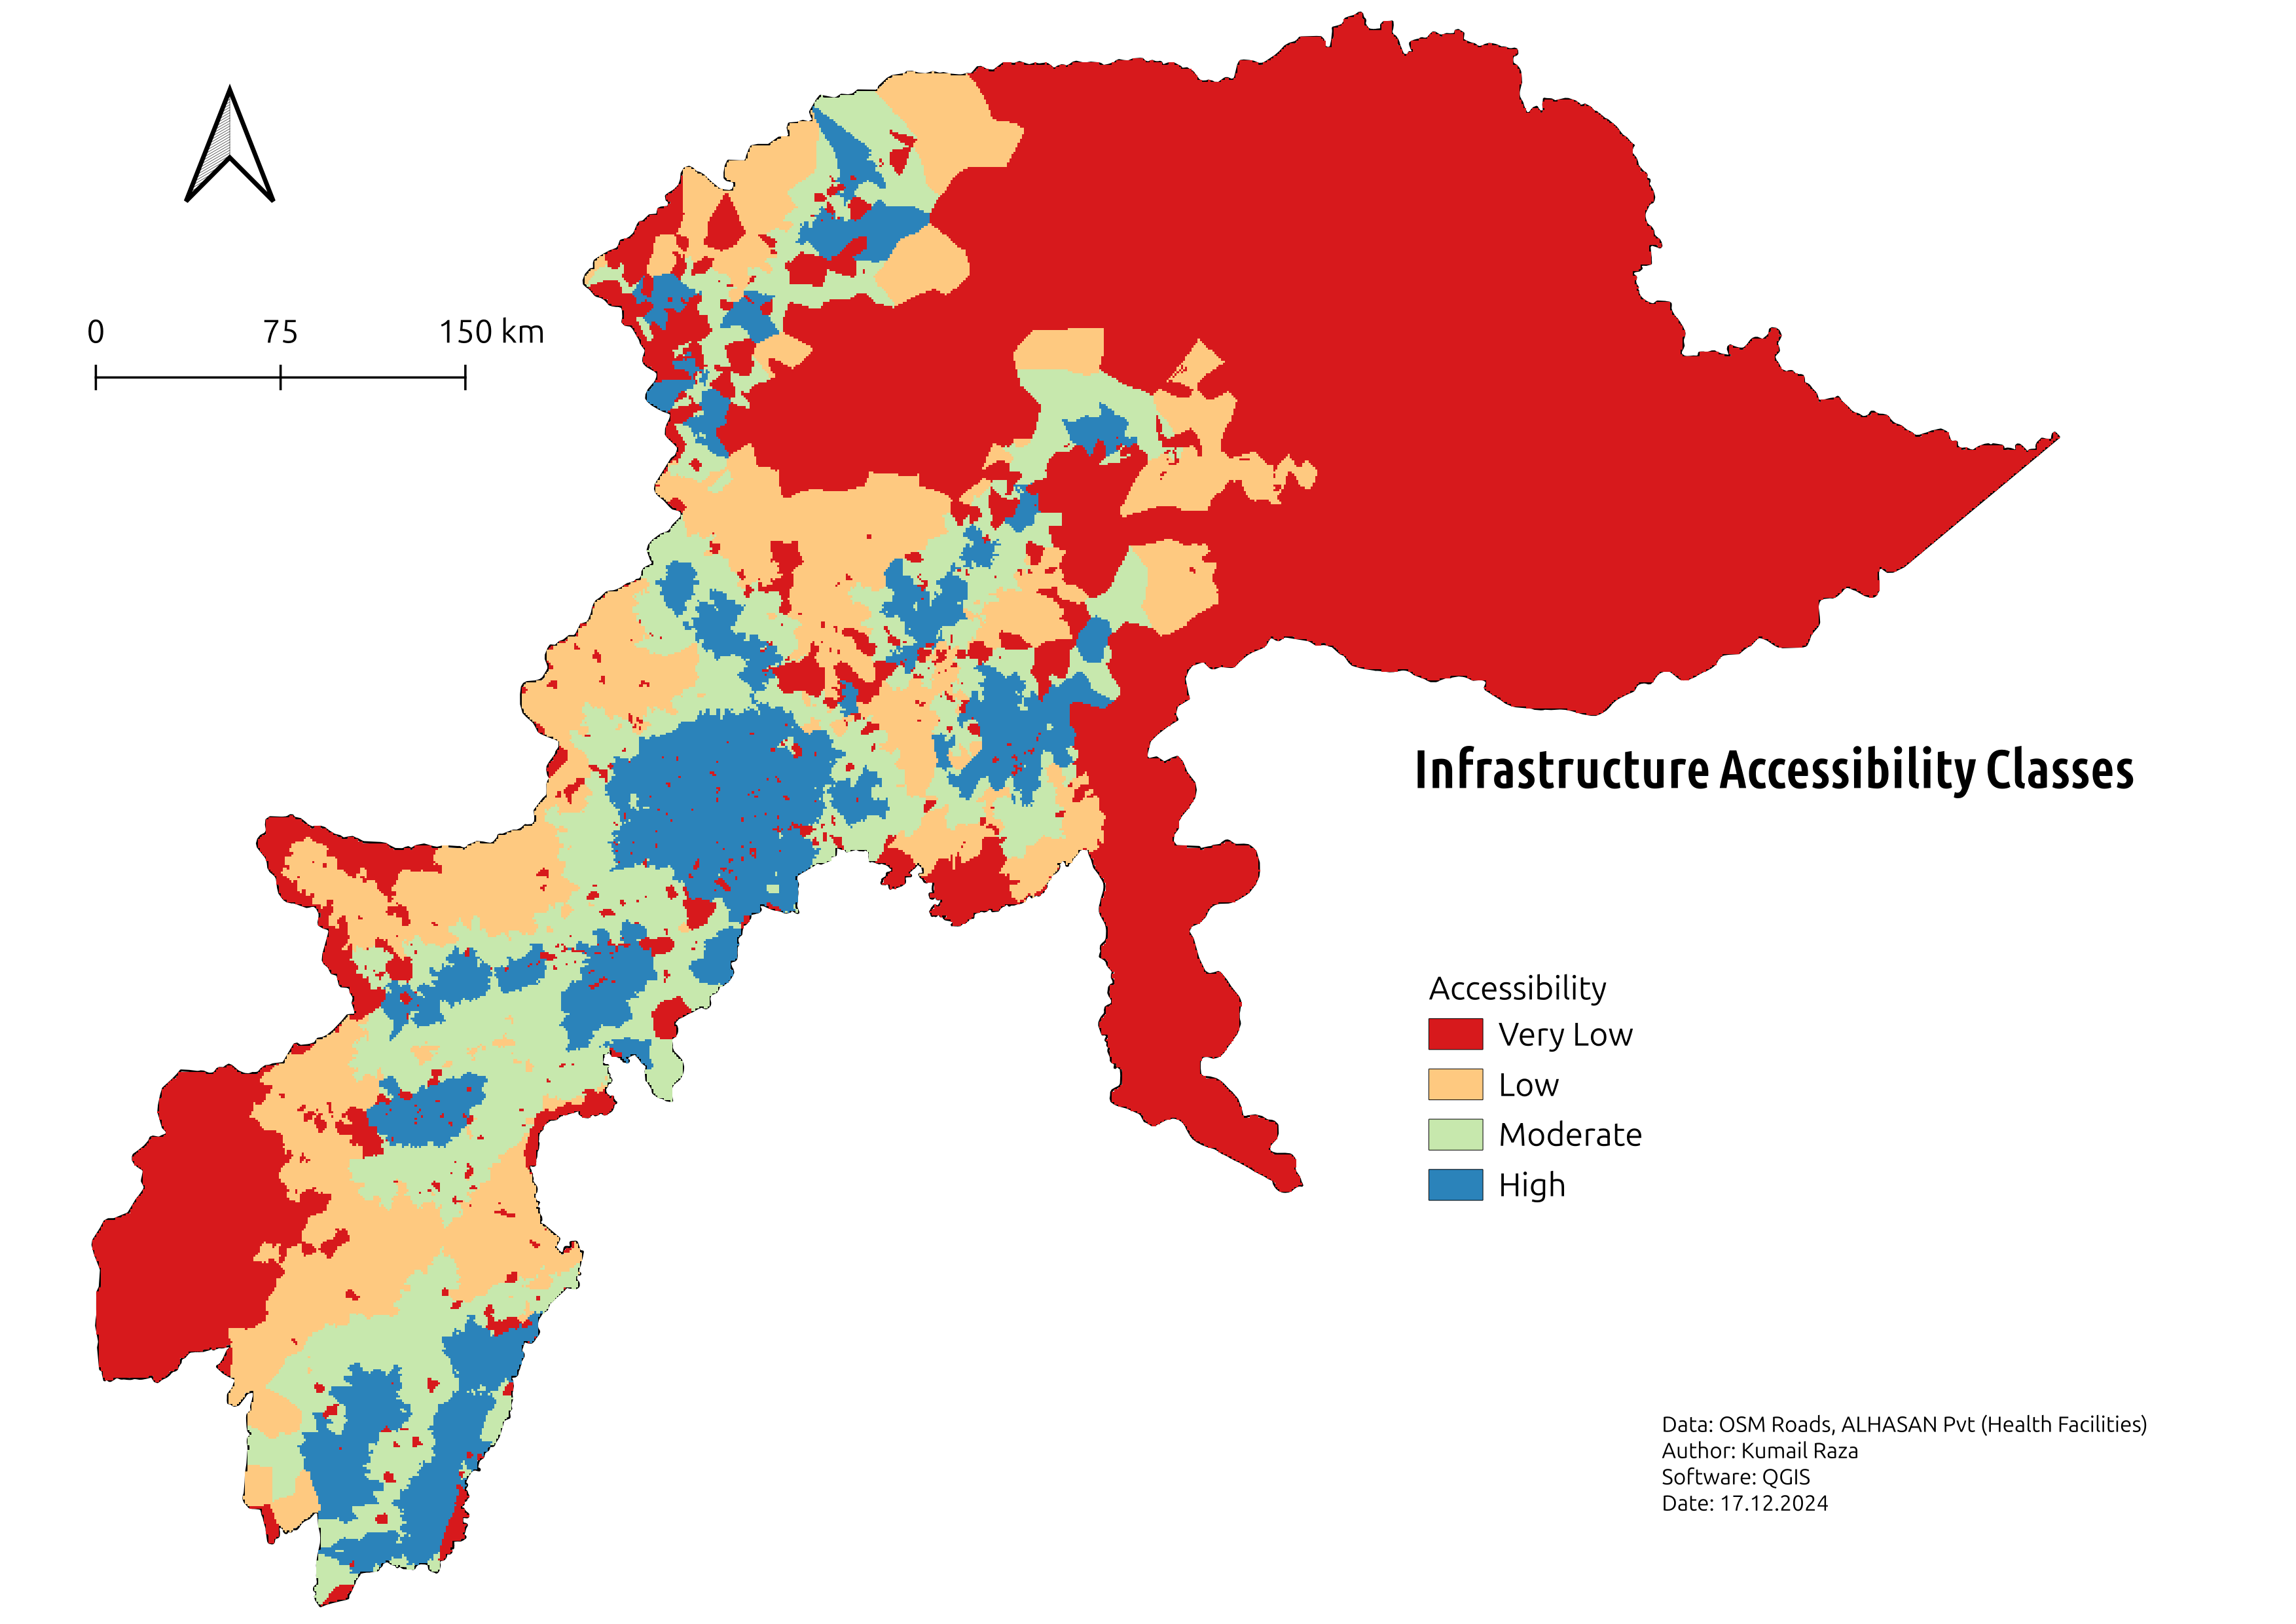
Adaptability: Infrastructure Accessibility
Accessibility scores range from High to Very Low. Urban centers fare better thanks to superior roads and services, enhancing their disaster response capabilities. Conversely, rural and mountainous zones register lower adaptability due to sparse infrastructure.
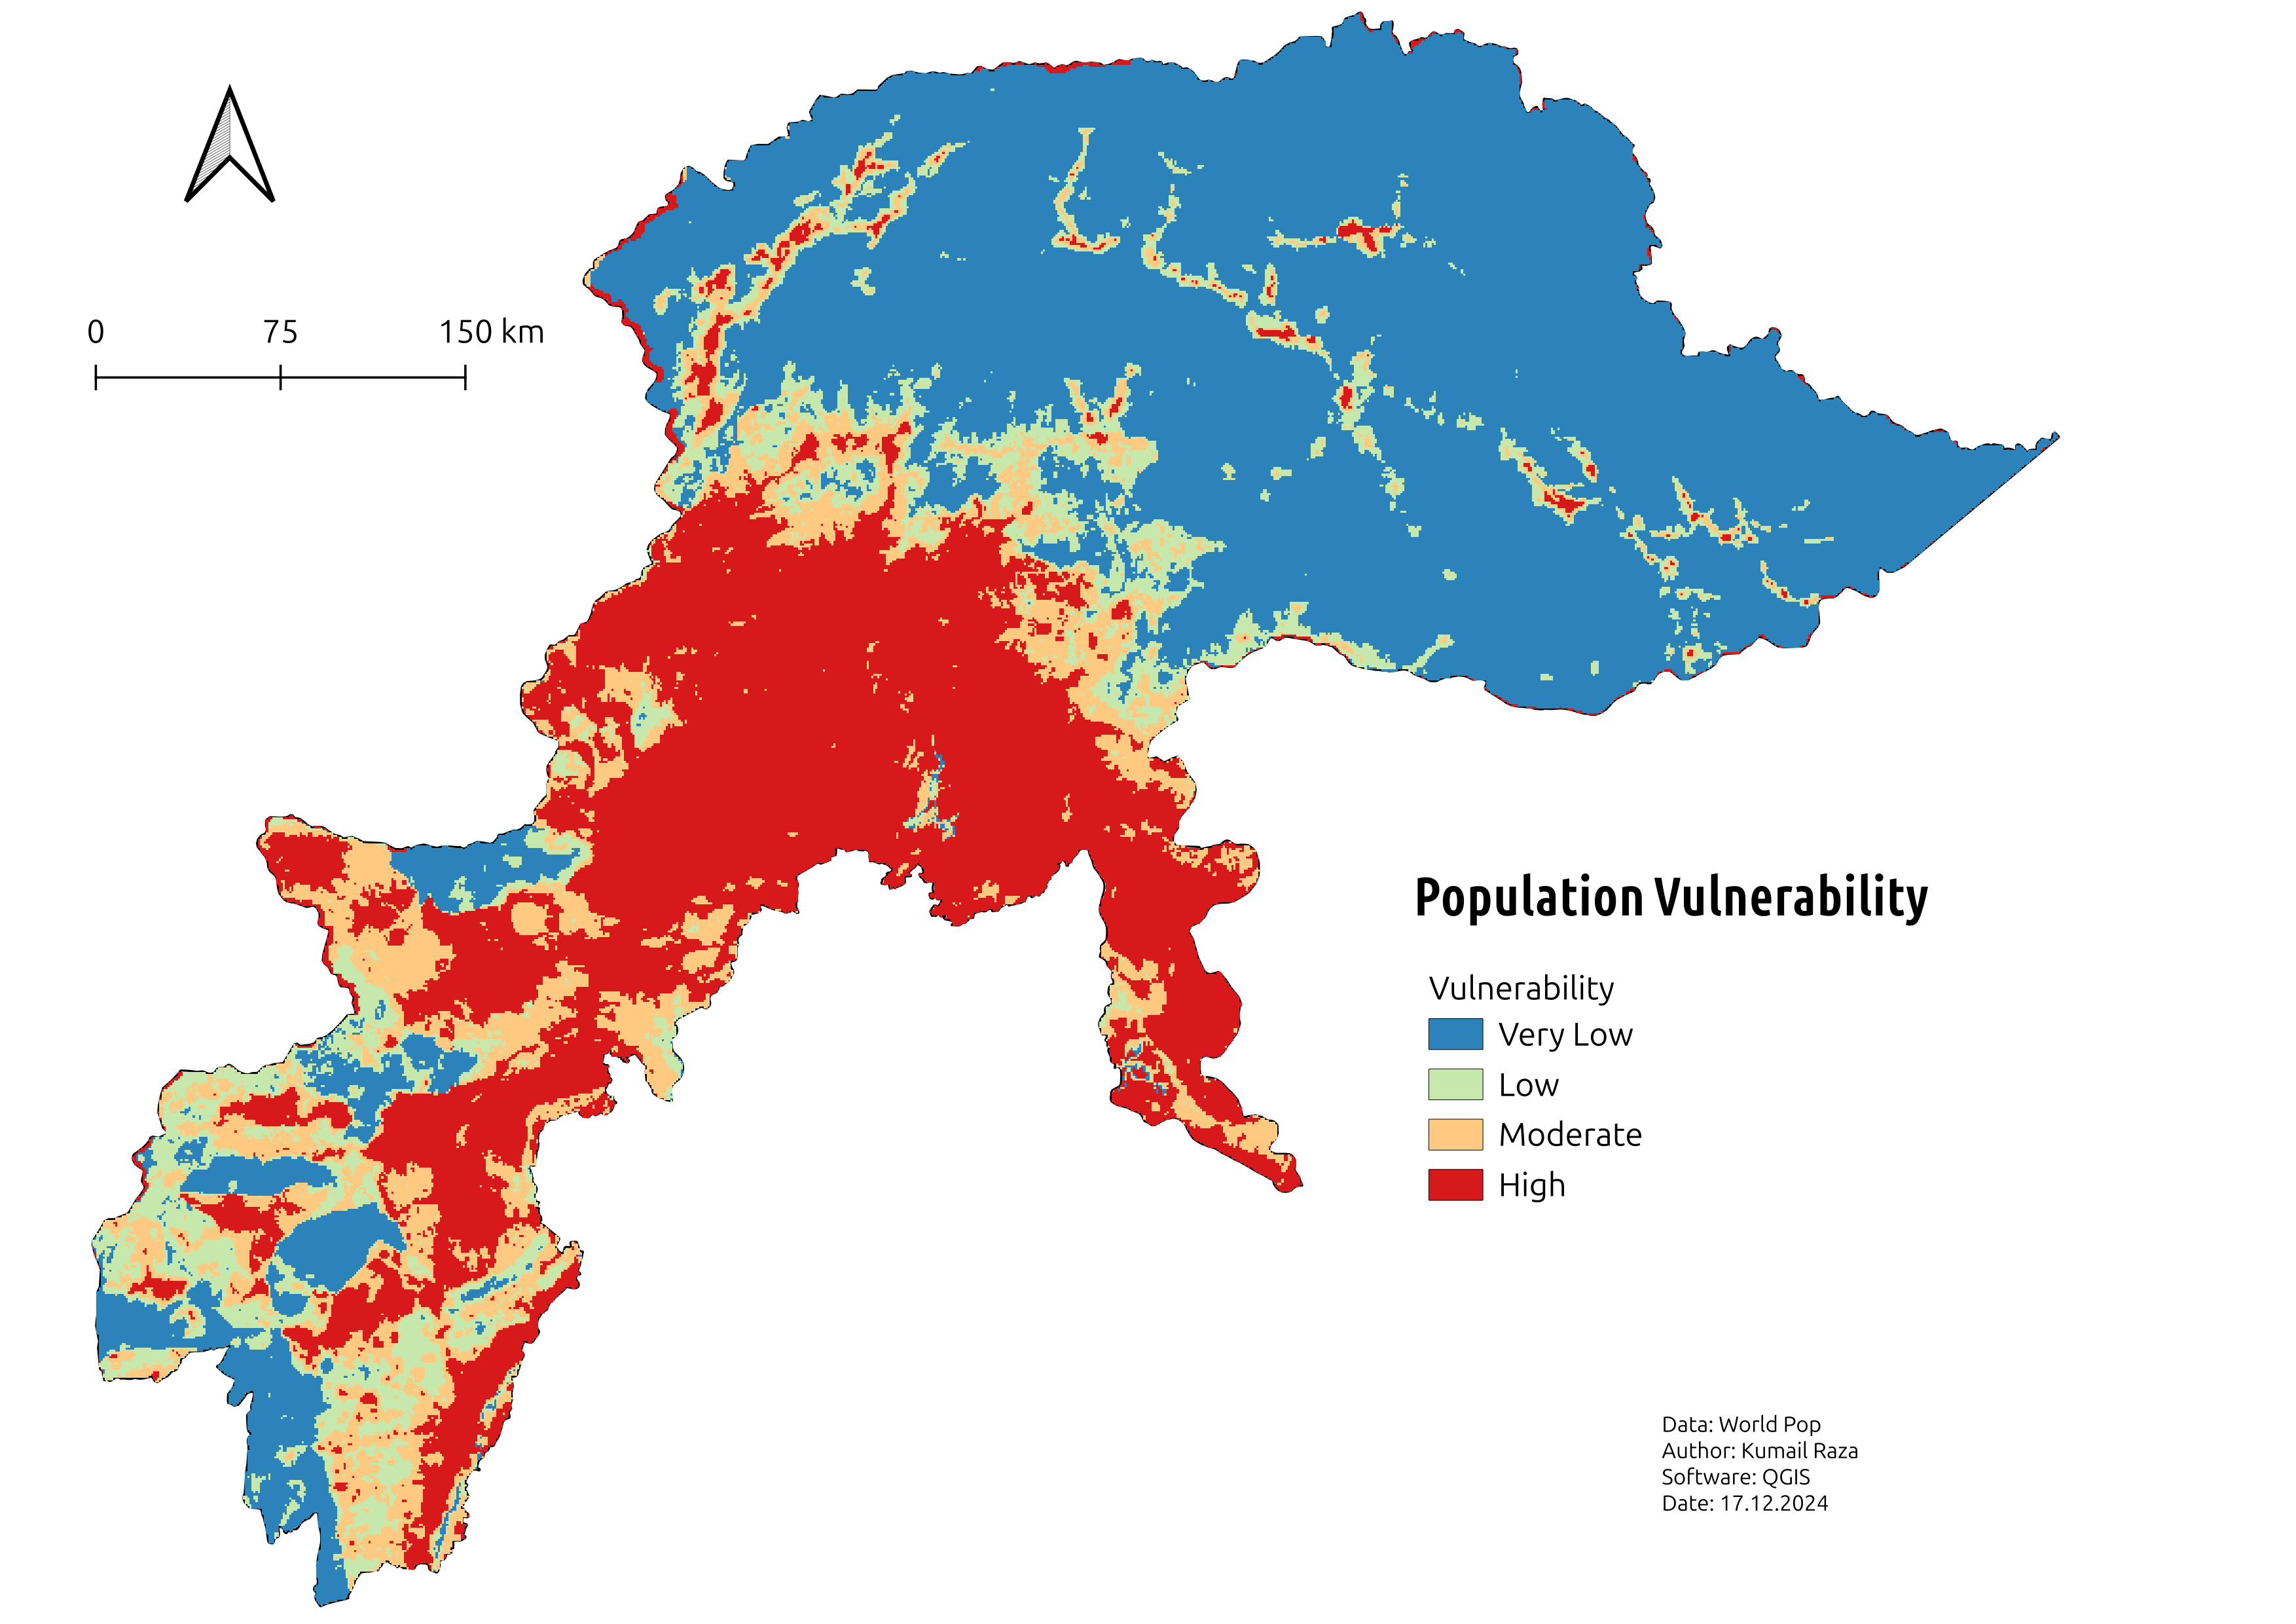
Population Vulnerability Classes
High vulnerability areas combine dense populations with high landslide risk. Low-risk zones either have sparse populations or lie outside major landslide hotspots, underscoring the uneven distribution of hazard exposure.
Analytic Hierarchy Process (AHP)
The AHP framework assigned weights of 53.9% to Infrastructure, 29.7% to Landslide Susceptibility, and 16.4% to Population. Consistency metrics (λ=3.007, CI=0.004, CR=0.007) confirmed the reliability of our pairwise comparisons.
Composite Vulnerability & Key Findings
The composite vulnerability map pinpoints high-risk zones where landslide susceptibility, dense populations, and inadequate infrastructure align. These hotspots demand urgent policy interventions, infrastructure investments, and disaster-preparedness strategies.
Insights
This study underscores the critical interplay between environmental hazards and socio-economic factors. By unifying exposure, sensitivity, and adaptability, our results spotlight areas most in need of targeted risk-reduction strategies and enhanced healthcare infrastructure.